前言
使用observability组件开启可观测功能后,需要有对应的接收端来接收可观测数据才能数据可视化的目的。本指导用于介绍如何搭建otelcol接收端,以及zipkin、Prometheus、elasticsearch和kibana等可视化后端
注意:上述可视化后端搭建均需先安装java jdk环境
一、 Otelcol接收端
基本介绍
otelcol全称为opentelemetry-collector,用于接收可观测数据,当前作为对接BMC可观测功能唯一的接收端,BMC发送的可观测数据都需要otelcol进行接收,然后再由otelcol转发到不同的可视化后端
搭建指南
-
从opentelemetry获取到最新的opentelemetry-collector工具,选择otelcol-contrib前缀的工具进行使用,如Windows系统可选择
otelcol-contrib_0.128.0_windows_amd64.tar.gz -
下载后进行解压缩得到可执行文件
otelcol-contrib.exe -
新建
config.yaml文件,输入以下内容:
receivers:
  otlp:
    protocols:
      http:
        endpoint: "0.0.0.0:6666"
        tls:
          client_ca_file: test_CA.pem
          cert_file: test_SERVER.pem
          key_file: test_SERVER_key.pem

exporters:
  debug:
    verbosity: detailed

service:
  pipelines:
    traces:
      receivers: [otlp]
      exporters: [debug]
    metrics:
      receivers: [otlp]
      exporters: [debug]
    logs:
      receivers: [otlp]
      exporters: [debug]
各个字段含义解释:
receivers为数据接收端,当前使用的是otlp格式,协议采用http发送
endpoint为接收端地址与端口,本地搭建可以写0.0.0.0,端口号与BMC的可观测页面设置的端口号保持一致
tls为开启TLS认证,当前BMC默认需要使用TLS传输可观测数据,因此otelcol必须配置该选项
client_ca_file为CA证书路径,用于双向认证中otelcol校验BMC证书
cert_file为服务器证书路径,用于BMC的CA证书校验otelcol证书
key_file为服务器证书私钥路径
BMC默认开启单向认证,因此otelcol必须要配置cert_file属性和key_file属性;如果开启双向认证,那么需要配置client_ca_file属性
exporters为数据导出器,用于表示数据需要导出到哪里
debug表示将otelcol接收到的可观测数据输出到终端
verbosity为输出信息的等级
service为配置traces、metrics和logs数据使用的receiver和exporter
当前receiver只有otlp,用于调试的话,exporter统一写为debug,那么otelcol接收到的可观测数据都会显示在终端上
- 启动otelcol
执行.\otelcol-contrib.exe --config config.yaml命令即可启动otelcol
如果提示某个端口号被占用,可以使用
netstat -ano | findstr :xxxx查看该端口号占用的程序,然后关掉对应程序后再次启动otelcol
二、 Zipkin可视化后端
Zipkin用于接收traces的可视化数据,安装方法可以通过Zipkin官网介绍进行参考
搭建指南
-
方案一:使用docker搭建,需要先安装docker,此处不赘述,可从docker官网下载进行安装
安装完成后在终端执行docker run -d -p 9411:9411 openzipkin/zipkin,冒号前的端口号可以修改,冒号后的端口号固定为9411 -
方案二:选择下载源码进行本地构建,按照Zipkin官网中 Running from Source的步骤进行安装
-
修改otelcol的配置文件
新增配置如高亮部分所示,ip填写zipkin所在的IP地址,port填写zipkin使用的端口号,使otelcol发送traces数据到zipkin后端,重启otelcol生效
exporters:
  debug:
    verbosity: detailed
  zipkin:
    endpoint: "http://ip:port/api/v2/spans"

service:
  pipelines:
    traces:
      receivers: [otlp]
      exporters: [debug, zipkin]
-
访问
http://ip:port即可访问到zipkin的页面,如果使用docker搭建,则ip为docker所在地址,port为docker启动zipkin的端口 -
点击设置指定查询时间范围,再点击查询即可获取到对应时间范围内的traces数据
三、 Elasticsearch与kibana可视化后端
Elasticsearch与kibana需要搭配使用,用于接收logs数据,elasticsearch用于接收,kibana用于将数据显示到web页面中
搭建指南
-
下载elasticsearch与kibana可执行程序
-
解压elasticsearch之后,执行
bin\elasticsearch.bat进行首次启动
Elasticsearch首次启动时,需要记录密码和token
第二次启动时将不会显示密码,只能通过重置密码进行获取
token用于kibana配置使用,半小时内有效,半小时后未配置kibana的话需要重新生成token
-
解压kibana之后,执行bin\kibana.bat进行首次启动,看到如图所示即为启动成功

-
访问上一步获取的链接进行页面登录
输入框输入刚刚启动elasticsearch生成的token,然后点击配置,然后等待配置完成即可 -
输入用户名与密码,用户名默认输入elastic
-
点击左侧菜单栏->Observability->Overview
-
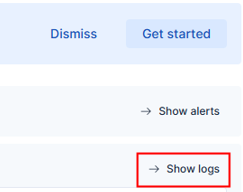
点击show logs查看上报的logs数据
-
修改otelcol的配置文件
新增配置如高亮部分所示,重启otelcol生效
exporters:
  debug:
    verbosity: detailed
  elasticsearch:
    endpoint: "https://localhost:9200"
    user: "elastic"
    password: "your password"
    tls:
      ca_file: http_ca.crt

service:
  pipelines:
    traces:
      receivers: [otlp]
      exporters: [debug, elasticsearch]
endpoint默认填写https://localhost:9200,由于kibana与elasticsearch必须使用TLS认证,因此需要添加tls配置
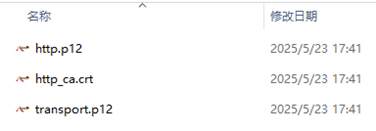
ca_file用于otelcol与elasticsearch进行认证,证书由elasticsearch首次启动生成,存放路径为elasticsearch目录下的config/certs,将ca证书复制到otelcol目录下即可
user填写登录用户名
password填写登录密码
- 完成后即可在elasticsearch页面查看接收到的logs数据
四、 Prometheus可视化后端
Prometheus用于接收metrics数据
搭建指南
-
获取可执行程序,可从官网进行下载
-
解压后修改
prometheus.yml文件
将scrape_configs部分进行修改,其中job_name可以替换为想要的名称,targets需要填写Prometheus所在的ip地址,端口号不能与49090相同,需要写另一个未使用的端口,如49091
scrape_configs:
  - job_name: "otelcol"
    static_configs:
      - targets: ["127.0.0.1:49091"]
-
启动Prometheus
执行./prometheus --web.enable-otlp-receiver --web.listen-address=0.0.0.0:49090 --config.file=prometheus.yml进行启动,其中49090端口不要修改 -
修改otelcol配置,增加高亮部分,重启生效
exporters:
  debug:
    verbosity: detailed
  prometheus:
    endpoint: "127.0.0.1:49091"
    namespace: "otelcol"

service:
  pipelines:
    traces:
      receivers: [otlp]
      exporters: [debug, prometheus]
- 登录http://localhost:49090访问Prometheus页面,进行metrics数据查询